4-Step Cheat Sheet to Make Data Work for Your Association

I’ve been working with associations for decades now and seen all the progress we have made around technology and yet I still hear the frustrations with data nearly every day:
"Why isn't our data working for us?"
"Our data is a mess and we can't rely on it."
"We’re not sure our data is accurate and we need help."
To help address these data quality concerns, I worked out this detailed cheat sheet on how to make data work for your association. The best part is that I’ve broken it down into the four key questions you need to answer to solve fundamental data quality issues.
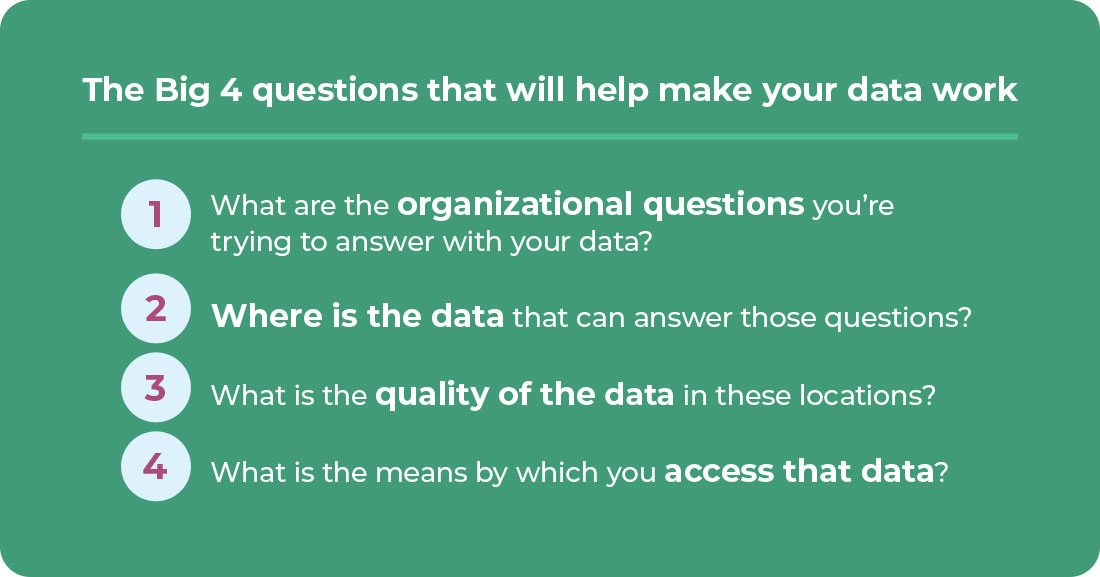
These “Big 4” questions include:
- What are the organizational questions you’re trying to answer with your data?
- Where is the data that can answer those questions?
- What is the quality of the data in these locations?
- What are the means by which you access that data (and answer THE questions)?
Before jumping into these questions, let’s briefly walk through the importance of data quality. Then, we’ll dive into the “Big 4” overarching questions and finally conclude with recommendations to make data work for you based on your responses to the “Big 4.”
Importance of Data Quality
In the association industry, you’re constantly stretched thin. With your busy staff and budget, finding the time to manage your data practices feels impossible.
But having insufficient resources doesn’t mean your data should fall to the wayside. The more you’re able to make data work for you today, the better decisions you’ll make tomorrow and the more time you’ll save.
Compared to organizations that rarely use data for decision making, organizations that leverage high-quality data are 10% more productive and save 10-20% on vendor costs for key technology systems. Overall, these data-driven businesses are better able to:
- identify opportunities
- improve efficiency
- create innovative products and services
On the other hand, bad data has systemic impacts on your entire organization. When issues with data accuracy and usability occur, it quickly becomes an association-wide issue.
For example, duplicate records could cause membership teams to waste resources browsing through records to make updates and process transactions. This data quality problem could in turn impact the member experience when duplicate records cause login issues.
Similarly, merging records with overlapping memberships could cause issues with the dues deferral process. The results can lead to conflicting or inflated data that burdens your membership and accounting teams as well as your members.
The power of quality data
The true power of quality data and reliable insights is underscored by 2021 data management research from Experian that surveyed business leaders across the U.S., U.K., and Brazil.
- 95% report negative impacts from poor data quality this year (e.g., damages to reputation/trust, analytics/reporting, and customer/member experience).
- 84% claim the need for data insights is greater now more than ever.
- 72% say digital transformation has increased their reliance on data and data insights.
- 63% see data management initiatives becoming more urgent.
There’s no question that improving data quality in both the short- and long-term is essential for any responsible and sustainable association.
Data as an asset
You can increase the value of your association by leveraging high-quality data that supports business functions. In other words, data is an asset if:
- The quality level is high.
- The data supports your organization’s needs.
These two factors are largely contingent on your data governance practices—or how data is collected, stored, maintained, classified, and made accessible in your organization.
“Data governance” is such an awkward term, right? Yet it’s one of the biggest buzzwords in the association industry today. The practice not only ensures security and compliance; it also allows you to improve performance by extracting value from the information collected and stored across your organization.
So, when it comes to making data work for your association, understanding your data quality issues is just a small portion of the challenge. You also need a clear picture of your data goals, warehousing or storage infrastructure, and the data architecture and standardization in place (or lack thereof).
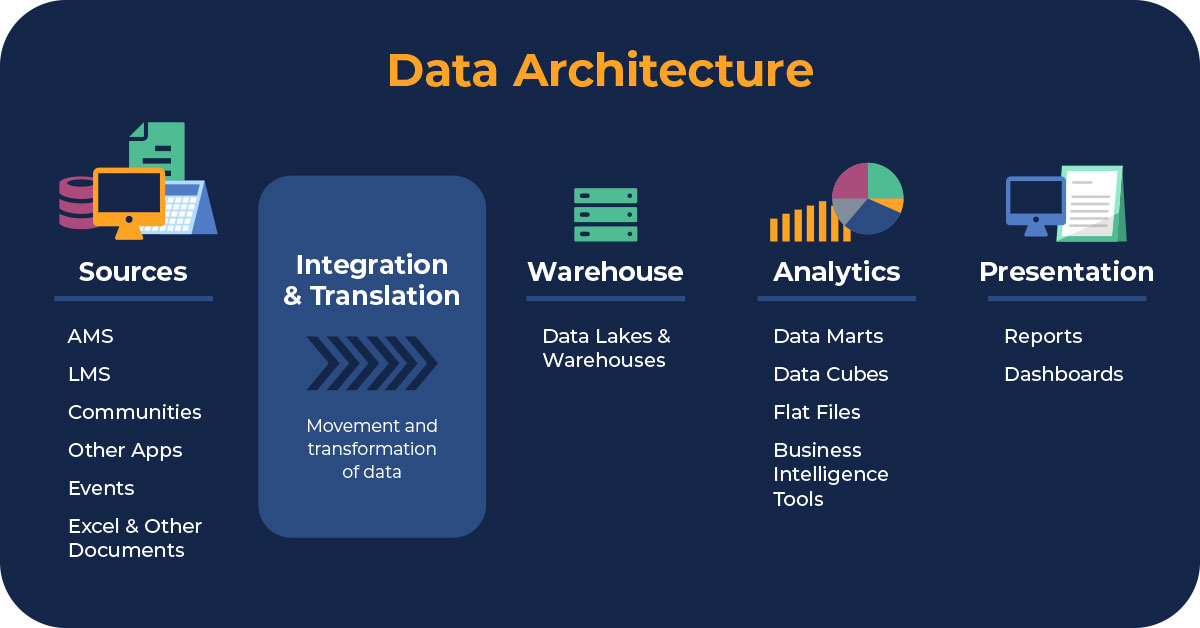
This graphic provides a nice overview of the data governance framework that is so crucial to the success of associations today. This leads us right into those “Big 4” questions you should answer to make data work for you, as each one deals with a different aspect of this framework.
The Big 4 Questions to Make Data Work for You
Question 1: What are the questions I’m trying to answer?
What does your organization need from data? And is your data fit for these given purposes?
You must understand the context behind your data needs to pinpoint and prioritize data quality issues and begin making data work for you. The first step is figuring out what you want to know about your data.
On a very fundamental level, maybe you want to know how many books or products you sold and what topics they were on. Or on a more advanced level, maybe you want to interpret buying trends and “hot topics” for members to identify content development needs for a different product line.
By making a list of the needs and questions you want to answer association-wide, department by department, you can begin connecting the dots between two different product lines, membership vs. non-dues revenue goals, or whatever it is you want your data to provide.
At Cimatri, one of the first things we do when assessing an organization’s need for better data quality is engaging the right people to uncover these key organizational questions. We’ll speak directly to users affected by poor data quality and interview stakeholders based on their use of data and any related processes.
We’ll ask broad questions such as, “How could corrected data benefit the business?” to discover data opportunities and potential corrections.
We’ll ask things like, “Are there any concerns about the limitation of your data?” and “What pet peeves do you have about the data?” to get more insight into data challenges, where frustrations with data are stemming from, and what information or needs are important to the organization and key stakeholders.
Then we’ll perform a value/risk assessment to organize and classify all the data used within the organization. This allows us to prioritize which data issue should be corrected first.
Question 2: Where does my data live?
Where is the data that can answer those important questions that we defined in step one?
Where is that data stored?
You probably have different systems and databases in use across your organization. But do you know which system you need to query to find each piece of data required to answer your list of questions?
For this exercise, it’s helpful to start making a list of all your data sources. Doing so may help you find extraneous data sources and rogue data that departments are using without IT’s knowledge.
At Cimatri, we often take this exercise to the next level and create various data flow diagrams to shed light on how data moves through the organization, as well as all the possible locations where your data lives.
Also, speaking directly with data users can reveal how data is accessed and stored. The same data can be consumed and stored in various ways, leading to outdated data sources, multiple local versions, data “ownership” and accountability issues, and a number of different results.
Getting a better understanding of where data issues exist can help you identify gaps in processes and promotes the health of organizational data in the short and long term.
Question 3: What is the quality of my data?
What is the quality of data in those locations we defined in question two?
This is where we get into data quality issues and the question of trust in your data.
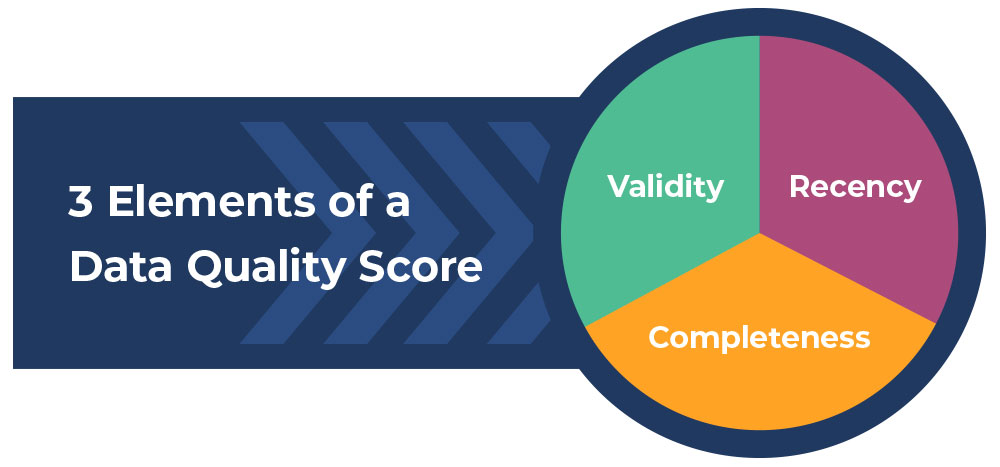
There are three essential metrics or variables of data quality we look at to score data and determine the value of your information.
The three elements of a data quality score include:
- Completeness
- Validity
- Recency
Scoring data quality isn’t a difficult project. When one of these three elements is questionable, it jumps off the page at you. Yet this exercise is so critical to improving the trustworthiness of your data, and ultimately, making your data work for your association.
Completeness
Is your data complete or are you missing key information you need to manage your association?
For example, do you know the age and location of your members? Are those fields filled out?
Consider all the data points you need to know to answer those big organizational needs listed in question one. For what percentage of the people in your system do you have that data?
Validity
The second piece of the data quality score is validity. Is the answer that’s recorded a valid and relevant answer?
For example, let’s say you have a dropdown for education level that includes five different options. But in your database, you come across “frosted flakes” for that field. Obviously, that’s an invalid and inaccurate answer.
In other words, this metric of your data quality score looks at the “wacky data”, if you will, or the data that may have been imported erroneously.
Maybe you find an email address in a text field that makes you do a double take. Or you may find a field marked “Other” when that is not one of the response options. Oftentimes these errors stem from system integration issues and poor data entry standards.
When we score this data quality metric, we check if there are errors, contradictions, or inconsistencies in your databases. We also look at any duplicate data and uniqueness issues.
Recency
The third piece of a data quality score has to do with timeliness. Is the information you have still accurate or do you have stale data? How recent or timely is your data?
For example, someone’s birthday doesn’t change over time, so you wouldn’t need to collect that piece of information again. However, interest areas may change over time and draw into question the usefulness and usability of that data.
If you’re a young professional early in your career, you probably have different interests than if you’re a seasoned pro late in your career.
In a database, if those changeable fields have data from 20 years ago, you will fail to hit the mark with personalized marketing if you’re using outdated interest data.
Question 4: How do you access the data you need?
What are the means by which we access the data and answer the big organizational questions we outlined in question one?
This question gets into the reporting aspect of data. People often want to talk about the fancy tools they have when asked this question. They may say to us, I have Tableau, Power BI, ZAP, or another proprietary analytics platform.
Let me fill you in on something though: the tool doesn’t matter. All of those tools do the job of presenting data well. What matters is that you have access to the information. The key here is that whoever asks the question is able to access the report or whatever is used to pull the data together.
For example, let’s say your IT department makes a report about membership numbers for your membership director. But the membership director doesn’t have access or the training to know how to connect into the system and run the report to get the answer to their own question. Or maybe they don’t know how to use the filter to manipulate the data to get the answer to the question.
That’s an underlying inefficiency for a supposedly routine analysis task that you’ll want to address.
The data quality payoff is when you can get the
right data to the right people at the right time.
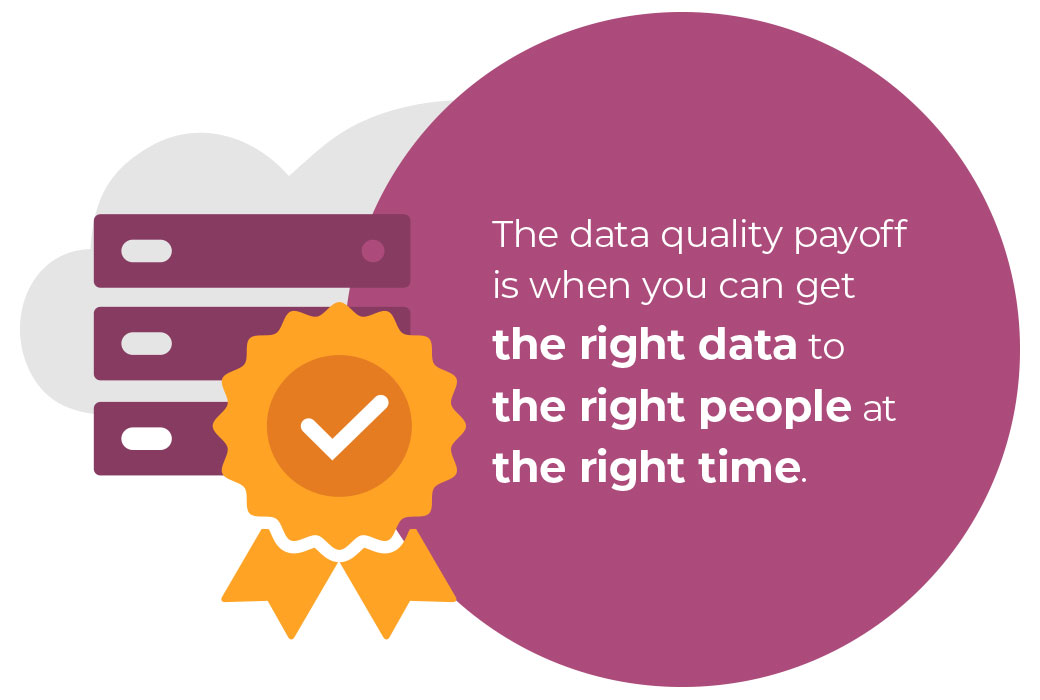
This is a key outcome of our data governance assessments and roadmaps: getting the right person the right answer to their questions, when they need it.
Again, the tool doesn’t matter. In fact, the answer can be in Excel—as long as it’s accurate, timely, and accessible to the person who needs it. You can make lots of pretty dashboards but what you really need is the information.
Where to go from here?
At Cimatri, we provide a narrative review of what we have uncovered while answering these “Big 4” questions, and then prescribe improvement strategies. We prioritize this list of recommended improvements based on the focuses of your organization and any low-hanging fruit that can offer quick wins.
Of course, addressing the symptoms of bad data quality and management will not correct long-term issues. Instead, we use root-cause analysis to identify the source of issues and align your people, processes, and technology behind strategic corrective efforts.
Let’s look at an example problem and solution.
Example Problem: Lack of Trust in Data
A common issue we see is a lack of trust in data stemming from oversights in data governance and organizational misalignment.
For instance, if you ask three different people the same question, most times you get three different answers. The event registrant field is a perfect example.
Here are potential responses to the question, “Who is an event registrant?”:
- Your CFO may say it’s only the people who have paid as a full conference registrant.
- The membership director may say it’s everyone who has registered regardless of payment.
- The event manager may say it’s everyone who registered regardless of payment, and including +1 guests, and the one-day registrants, and the pre-conference-only registrants.
In short, you get three different answers.
The problem is your IT department may then put up a chart showing the “number” of event registrants. But what does that number actually represent? Which of the three definitions of an event registrant?
Each person is expecting their measurement in this presentation of the data and when they see a different statistic, they lose confidence in the data.
One person may say it’s right and another says it’s wrong because they haven’t agreed as a group on the definition and data criteria for the entire organization.
So, what’s the best course of action to correct this issue? Conducting a series of data governance exercises.
Example Solution: Data Governance Exercises
A good place to start is to have a group conversation to define criteria for the data in question. Supplement those conversations with a list of terms to sort out the madness.
Then you can put a footnote or field explanation on your dashboard so everyone is clear on the meaning of the data. Plus, when there’s turnover in a position, the next person will understand the criteria for each data point.
The next set of conversations is about agreeing to a formula to calculate different metrics.
You may want to put a metric on the dashboard but have different opinions within your organization on the formula and definition. Once everyone is on the same page, then your IT person can use that agreed-upon formula to calculate the metric.
Getting Started
Are you ready to finally start making data work for your association? You already have the data you need, now it’s time to make it work in your favor.
Our data quality assessment generates a detailed report card of your data quality as well as improvement strategies to help you focus your efforts to meet stakeholder needs.

Related Posts